


The apparent distribution of nearby groups (figs. 3 and 4) strongly reflects the concentration of bright galaxies toward the plane of the Local Supercluster (Holmberg 1937; de Vaucouleurs 1953, 1956b, 1958, 1960b; Carpenter 1961; Abell 1961).
Table 10 gives counts of various systems (``outstanding'' galaxies, DDO dwarfs, and nearby groups) as a function of supergalactic latitude separately for the center sector (northern galactic hemisphere) and anticenter sector (southern galactic hemisphere). Comparison of the observed relative frequencies within 10°, 20°, or 30° from the supergalactic equator with the values computed for a random (uniform) distribution (with allowance for galactic obscuration from the Hubble counts of faint galaxies) brings out the strong concentration of all systems to the supergalactic plane. The only possible exception is the Local Group - which is not surprising considering its small volume and our location in it. For all other systems some 75-100 percent of the total population is within 30° of the supergalactic equator (means: 88% in N.G.H., 80% in S.G.H.), as compared with 59 percent for a uniform distribution. The average ratio O/C = (observed)/(computed) varies with supergalactic latitude as follows:
| (0, ± 10°) | (0, ± 20°) | (0, ± 30°) | |
| Galaxies: O/C | 2.3 | 1.75 | 1.45 |
| Groups: O/C | 2.15 | 1.45 | 1.35 |
| Systems | Supergalactic Latitude B | |||
| N(0°, ± 10°) | N(0°, ± 20°) | N(0°, ± 30°) | NT(0°, ± 90°) | |
| Local Group (fig. 1): | ||||
| N | 0 (0%) | 2 (20%) | 4 (40%) | 10 |
| S | 4 (25%) | 11 (69%) | 12 (75%) | 16 |
| N+S | 4 (15%) | 13 (50%) | 16 (62%) | 26 |
| ``Outstanding'' galaxies (fig. 7): | ||||
| N | 25 (69%) | 30 (83%) | 32 (89%) | 36 |
| S | 10 (42%) | 18 (75%) | 20 (83%) | 24 |
| N+S | 35 (58%) | 48 (80%) | 52 (87%) | 60 |
| Dwarf galaxies (fig. 6): | ||||
| N | 85 (49%) | 114 (66%) | 146 (85%) | 172 |
| S | 16 (32%) | 26 (52%) | 38 (76%) | 50 |
| N+S | 101 (45%) | 150 (63%) | 184 (83%) | 222 |
| Nearer groups (fig. 3): | ||||
| N | 6 (75%) | 7 (88%) | 8 (100%) | 8 |
| S | 5 (55%) | 6 (66%) | 8 (89%) | 9 |
| N+S | 11 (59%) | 13 (77%) | 16 (94%) | 17* |
| Nearby groups (fig. 4): | ||||
| N | 5 (36%) | 6 (43%) | 11 (78%) | 14 |
| S | 12 (38%) | 18 (56%) | 24 (75%) | 32 |
| N+S | 17 (37%) | 24 (52%) | 35 (76%) | 46** |
| All nearby groups: | ||||
| N | 11 (50%) | 13 (59%) | 19 (86%) | 22 |
| S | 17 (41%) | 24 (59%) | 32 (78%) | 41 |
| N+S | 28 (45%) | 37 (59%) | 51 (81%) | 62 |
| Random*** | 21% | 41% | 59% | 100% |
* Counting UMa-Cam Cloud as three groups, Coma I as two groups.
** Counting Get I, Get II, Vir III, Pavo-Indus as two groups each,
Eri I as three groups.
*** Including allowance for effect of galactic obscuration.
The flattened local supersystem is also clearly in evidence when the
space distribution of the 55 nearby groups and clouds is mapped as in
figures 8 and 9. The
supergalactic rectangular coordinate system is
defined as follows: OX = line of nodes of supergalactic and galactic
planes, X > 0 in direction L = 0° defined by
lI = 105°, bI = 0°
(de Vaucouleurs 1958,
1960b),
OY = direction of L = 90°
(in Coma), OZ =
direction of supergalactic north pole at lI = 15°,
bI = +5°.
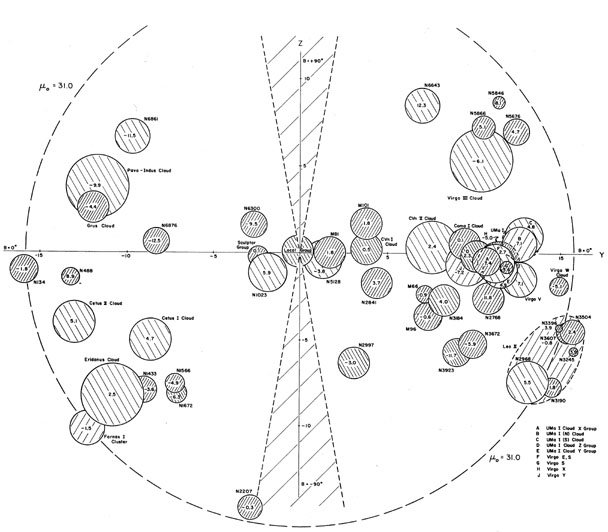
Figure 8
is a projection in the (Y, Z)-plane; and since the center of the
supercluster is apparently in the direction of the
Virgo cluster (L =
104°), this projection approximates a meridional cross-section. Note
the accumulation of groups within 5 Mpc from the supergalactic plane
for Y > -5 Mpc. The dashed line marks the radius
( = 16 Mpc) of the
survey. The third coordinate X is shown in each group. The shaded
20°
fan along the Z-axis marks the approximate limits of the galactic zone
of avoidance. Note the wide gap (not due to obscuration) between the
Sculptor group and the more distant groups in the
southern hemisphere (Y < 0).
= 16 Mpc) of the
survey. The third coordinate X is shown in each group. The shaded
20°
fan along the Z-axis marks the approximate limits of the galactic zone
of avoidance. Note the wide gap (not due to obscuration) between the
Sculptor group and the more distant groups in the
southern hemisphere (Y < 0).
|
Figure 8. Space distribution of nearby groups projected onto the supergalactic (Z, Y) plane. |
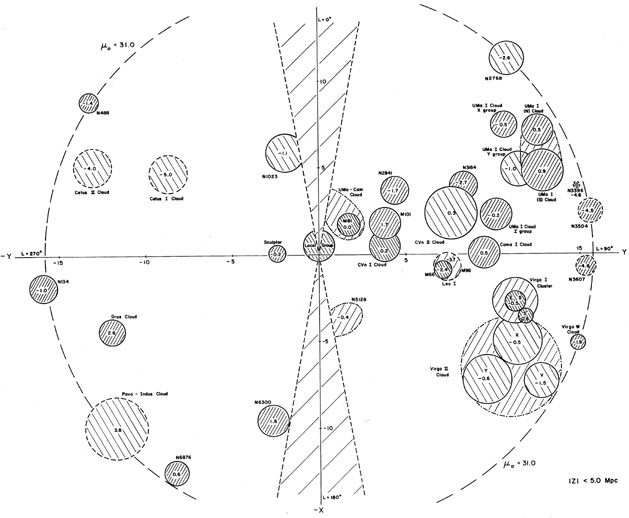
Figure 9 is a projection in the supergalactic
(X, Y)-plane of the
groups and clouds for which |Z| < 3 Mpc (full circles) and
3 < |Z| < 5
Mpc (dashed circles). The value of Z is shown for each
group. This is
a first approximation map of that part of the ``Local Supergalaxy''
which falls within the 16 Mpc radius of the survey. Galaxy counts
(Reiz 1941;
de Vaucouleurs 1956b,
1960b;
Carpenter 1961)
indicate that
the Local condensation extends to about twice this distance beyond the
Virgo cluster or to Y
 +
30. The Local Supercluster, then, may
encompass all groups and clouds within a radius of 15-20 Mpc from a
center in the general vicinity of the Virgo cluster (there is no
necessity for the center of mass to be within any particular cluster)
and within 5-10 Mpc from the supergalactic plane. This includes the
majority of the northern nearby groups and clouds but probably
excludes most of the southern clouds beyond 7 or 8 Mpc.
+
30. The Local Supercluster, then, may
encompass all groups and clouds within a radius of 15-20 Mpc from a
center in the general vicinity of the Virgo cluster (there is no
necessity for the center of mass to be within any particular cluster)
and within 5-10 Mpc from the supergalactic plane. This includes the
majority of the northern nearby groups and clouds but probably
excludes most of the southern clouds beyond 7 or 8 Mpc.
|
Figure 9. Space distribution of nearby groups with |Z| < 5 Mpc projected onto the supergalactic (X, Y) plane. |
Note the strong indications of subclustering within the supersystem; as already noted, there is evidence for a ``Local Cloud'' (or cloud complex) including the Local Group, Sculptor, M81, M101, NGC 2841, NGC 1023, NGC 5128 groups, and CVn I; another cloud complex could include CVn II, Coma I, and UMa I (Z); other examples are UMa I (N + S, X, Y), Virgo II (X, Y, V), and Leo II.
The Local Cloud includes all the nearer groups within
7 Mpc and
with very few exceptions comprises only spirals and Magellanic
irregulars among its 40 or 50 brighter members; the average type index
is  = + 5.1
(
= + 5.1
( t = 2.9). For
comparison the average type index is
+ 3 for all groups in the range 7 <
< 15 Mpc and
0 for
> 15 Mpc.
t = 2.9). For
comparison the average type index is
+ 3 for all groups in the range 7 <
< 15 Mpc and
0 for
> 15 Mpc.
The research incorporated in this chapter was supported in part by the National Science Foundation and the U.S. Navy Office of Naval Research. The collaboration of Mrs. A. de Vaucouleurs and the assistance of Mrs. J. Weiss and Mr. H. Corwin greatly expedited the project.