


7.1 Completeness of Survey
The frequency distribution of distance moduli of the 54 groups in Table 2 plus the Local Group is given in Table 5.
|
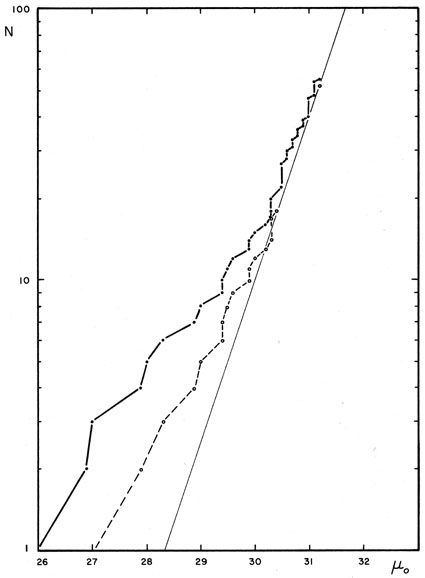
Figure 5. Cumulative frequency distribution of distance moduli of nearby groups (including Local Group). |
A plot of the cumulative frequencies N =
 n
(fig. 5) is consistent
with the relation N
n
(fig. 5) is consistent
with the relation N 
 3,
i.e., log N = a + 0.6 µ0, expected for a
statistically uniform space density of cluster centers in the range 30
< µ0 < 31. There is an apparent excess of nearby
groups for µ0 < 30
due in part to a genuine higher density near the Local Group and in
part to the fact that a finer division of groups is possible in our
immediate neighborhood; at larger distances an increasing proportion
of groups have been included in larger clouds. To compensate for this
effect let us visualize (figs. 8 and
9) the region of the Local Group
observed from a great distance, say, from the Virgo cluster; then the
M81, Sculptor, and Local Groups might appear merely as
condensations
in the same cloud (our Local Cloud) and the NGC 5128 chain might be
unnoticed. The circles and dashed line in
figure 5 correspond to the
corrected frequency function allowing for this effect. The presence of
a Local Cloud is still in evidence, but the approximation to the
3
law is quite good for µ0 > 29 and apparently
right up to the limit of
the survey at µ0
3,
i.e., log N = a + 0.6 µ0, expected for a
statistically uniform space density of cluster centers in the range 30
< µ0 < 31. There is an apparent excess of nearby
groups for µ0 < 30
due in part to a genuine higher density near the Local Group and in
part to the fact that a finer division of groups is possible in our
immediate neighborhood; at larger distances an increasing proportion
of groups have been included in larger clouds. To compensate for this
effect let us visualize (figs. 8 and
9) the region of the Local Group
observed from a great distance, say, from the Virgo cluster; then the
M81, Sculptor, and Local Groups might appear merely as
condensations
in the same cloud (our Local Cloud) and the NGC 5128 chain might be
unnoticed. The circles and dashed line in
figure 5 correspond to the
corrected frequency function allowing for this effect. The presence of
a Local Cloud is still in evidence, but the approximation to the
3
law is quite good for µ0 > 29 and apparently
right up to the limit of
the survey at µ0
 31. This is because in
preparing this chapter all
identifiable groups with µ0 < 32 (and many
beyond) were considered and
only those with µ0
31. This is because in
preparing this chapter all
identifiable groups with µ0 < 32 (and many
beyond) were considered and
only those with µ0  31.0 (31.2 to allow for accidental errors) are
discussed here. Hence the survey should be substantially complete out
to µ0 = 31.0
( = 16 Mpc) except, of course,
for the obscured galactic belt (about one-fifth of the sky area).
31.0 (31.2 to allow for accidental errors) are
discussed here. Hence the survey should be substantially complete out
to µ0 = 31.0
( = 16 Mpc) except, of course,
for the obscured galactic belt (about one-fifth of the sky area).
| 26.0 | 27.0 | 28.0 | 29.0 | 29.5 | 30.0 | 30.5 | 31.0 | ||
| µ0 | <26 | 26.9 | 27.9 | 28.9 | 29.4 | 29.9 | 30.4 | 30.9 | 31.2 |
| n | 1 | 1 | 2 | 3 | 3 | 4 | 7 | 18 | 16 |
| N = n
| 1 | 2 | 4 | 7 | 10 | 14 | 21 | 39 | 55 |
* Including Local Group.